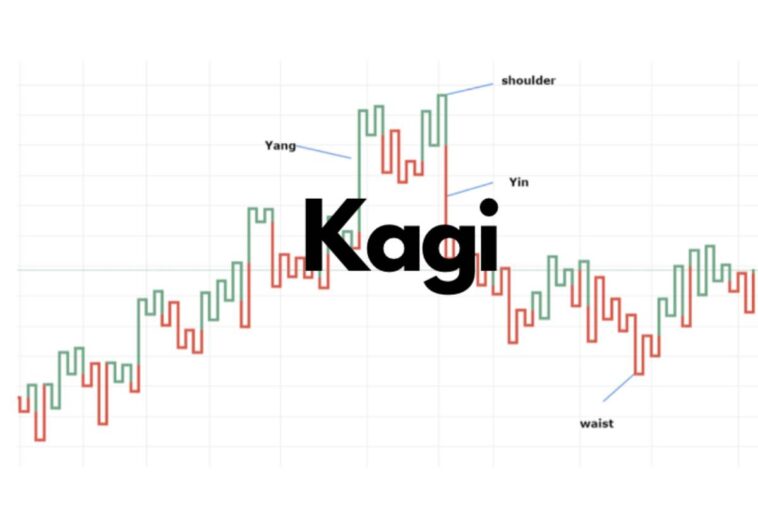
The world of trading and finance can seem convoluted, especially with the various charting methods and techniques. One such technique is the Kagi chart, a unique system that may initially seem daunting but can become a potent tool in the right pair of hands. In this article, we will dive deep into the Kagi chart, its core elements, and how it compares to traditional candlestick charts. Furthermore, we’ll explore its role in constructing trading strategies, and how it can be implemented in Forex trading.
Table of Contents
Understanding the Kagi Chart: A Deeper Dive
The Kagi chart, originating from Japan, is a distinct charting method utilized to track the price movements of securities. Unlike traditional Western charts, the Kagi chart focuses purely on price action, disregarding timeframes.
Each line on a Kagi chart represents a set price movement, whether it’s upwards or downwards. This method provides a cleaner look at market trends, reducing the noise of small price fluctuations.
The main initiative behind these charts is to filter out minor price movements to exhibit primary trends. To learn more, this Kagi chart definition elaborates on the concept in detail.
Despite their simplicity, Kagi charts can provide valuable information about market sentiment, making them a popular choice among experienced traders.
The Core Elements of Kagi Charts
The base of the Kagi chart consists of a series of vertical lines connected by short horizontal lines. The thickness and direction of the lines are the two key elements to pay attention to.
A line becomes thicker when an asset’s price surpasses the peak of the previous line, often construed as a buy signal. Conversely, a line becomes thinner when the price is below the trough of the previous line, interpreted as a bearish reversal or a sell signal.
These changes in thickness can provide clear signals about market trends and the sentiment among investors.
Although Kagi charts might appear simple, they encapsulate the price dynamics in an easy-to-read format that paints an accurate picture of the market.
The Role of Kagi Charts in Trading Strategies

Alt text: A man sitting at a desktop computer with three monitors analyzing a chart.
A core aspect of the use of Kagi charts in trading strategies is its ability to depict market sentiment. By following the thickness of the Kagi chart, traders can quickly and easily discern potential buy and sell opportunities.
They create an in-depth view of volatility, allowing the creation of diversified trading strategies. This serves as a strong alternative to the often misguiding price data or staggered time-based charts.
Another way that Kagi charts can be employed is in combination with other types of volatile price-moving metrics. The synchronized use of these techniques can create an extremely effective trading strategy.
Furthermore, traders also use them to set stop-loss levels, reducing potential losses if the market becomes unfavorable.
Comparison of Kagi Charts and Traditional Candlestick Charts

Alt text: Candlesticks with lit candles in them situated in graphical symbols on a black background to represent the difference between Kagi charts and candlestick charts.
One of the principal differences between Kagi charts and traditional candlestick charts is the way they portray data. Candlestick charts consider time as an essential factor, whereas Kagi charts focus solely on price movements.
The emphasis on price action means that often it is much easier to identify key price points and trading signals on a Kagi chart.
Additionally, Kagi charts can deliver clearer signals with less market noise, allowing for better trading decisions. As such, they are favored by traders who focus primarily on price action.
Despite the benefits of Kagi charts, it must be remembered that no charting method is flawless. Both Kagi and traditional candlestick charts have their strengths and weaknesses, and the choice between the two would ultimately depend on the trader’s strategy and comfort.
Altogether, Kagi charts provide an alternative take on charting and have a unique place in a trader’s arsenal. Their function of highlighting significant price movements allows traders to execute better-informed decisions, potentially leading to improved trading outcomes.

